Mach: A Pluggable Metrics Storage Engine for the Age of Observability
The #4 paper I’m covering from CIDR 2022 is this paper that covers a new Pluggable storage engine for storing metrics, with collaboration from Slack, Intel, Brown, CMU, and MIT.
This is an interesting paper as it is a great example of how a specifically designed storage engine for a use case such as monitoring can yield quite a big difference in performance compared to existing time-series databases.
What’s in Observability Data?
Today all production systems store monitoring metrics from services either sent to external products like Datadog or stored in monitoring systems that are usually backed by time-series databases such as Influx or metrics storage systems like Prometheus.
Peeking into what monitoring data looks like, each service or instance (aka source) usually emits a fixed set of labels with a series of values with a timestamp.
The challenge of storing this data is that it can be huge. The paper specifically talked about Slack, which collects metrics from 4 billion unique sources per day at a rate of 12 million samples per second, generating up to 12 TB of compressed data every day.
Also, each source emits data with variable time delay and can start and stop at various times.
Challenge of using existing systems
Current systems that are commonly being used such as time-series databases (Influx, Timescale, Clickhouse, etc) are built for good support for analytical queries but don’t have great ingestion performance.
Monitoring storage systems such as Prometheus do have better ingestion performances. However, it still has scalability problems when hitting a certain scale threshold as it’s designed to ensure multiple writers to the same data source are in order with a mutex per source, which contributes to 25% of the write performance overhead.
More scalable versions of Prometheus such as M3 and Thanos alleviate these problems by running a sharded Prometheus with a coordination layer on top. This helps scale the existing Prometheus design but each shard still performs the same way.
How MACH works
Mach is designed to be able to handle ingesting large amounts of sources and metrics data with a variable rate (multivariate) while having low latency reads in real-time.
The key design to improve ingestion is to have an architecture with minimal locking and global state and to have loosely coupled components with minimum locking and coordination. This allows Mach to scale to a larger scale of writers and readers with better performance.
Time-series databases allow updates and out-of-order writes which requires them to store and organize data with B+ trees or similar, which slows down the ingestion performance. Mach assumes data is mostly in order and no updates are allowed, which allows writers to directly be appended and have optionally an out-of-order in-memory buffer that gets merged later.
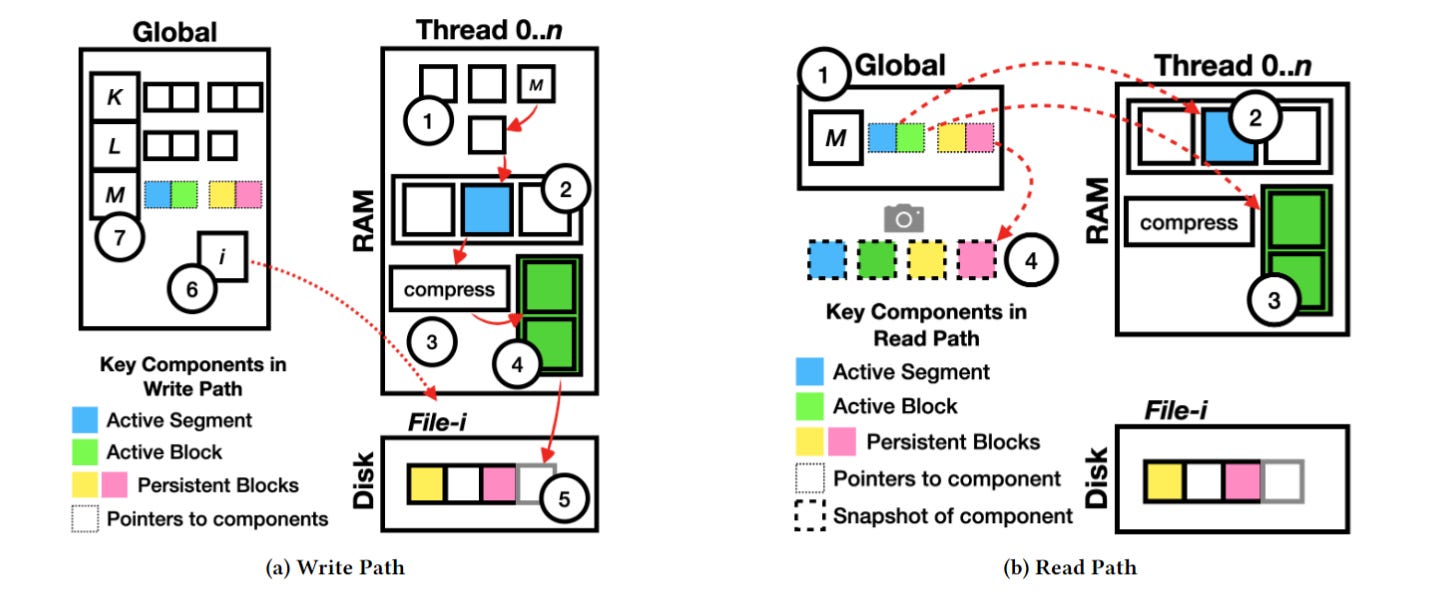
Each Mach writer thread holds its own state and writes to a single segment in memory, whereas the global hash table only holds which source write should be routed to which writer thread.
Each writer has three levels of data per writer:
Active Segment: It first appends to the active segment in memory up until a certain configured size
Active Block: Once the segment is full, it moves to compress the full segment in memory in batch, instead of compressing on each write in TSDBs. This becomes part of an active block in memory
Persistent Block: Once the active block is full, the full block is appended to a dedicated file for the writer thread on disk. Once the file size exceeds the limit, the writer acquires a new file to write.
On the read side, Mach serves read requests by creating snapshots based on the source and time of the request, which records the block metadata written in all three levels of writer data without blocking any writes. The requestor can then request to read blocks that are within the time range requested, which is also efficient given most already appended data are immutable and only requires fast locking.
How fast is Mach?
Using data coming from 700 data sources each with 18 metrics and 32 samples each, Mach outperforms the 2nd fastest system in terms of ingestion by 2-4x (depending on the rate of data), which also outperforms InfluxDB by 20x and RocksDB by 60x. Running with 1 million data sources, Mach consistently performs 4x over Prometheus, while InfluxDB and RocksDB both timed out.
On read performance, while reading data that are within the recent 1 hour, Mach and Prometheus both perform 5x better than InfluxDB as they’re both designed to serve recent data faster. However, when reading data within the last 24 hours, InfluxDB is on par with Mach, but cannot scale once concurrent reads start to increase.
Final thoughts
It’s interesting to see the tradeoff when it comes to designing a storage system, between balancing both write/read performance and also the range of queries and the temporal characteristics.
It’s also another case where a share-nothing design leads to much scalable performance on a single node, which is similar to how newer systems like Scyalladb and Redpanda (leveraging Seastar) also help reduce bottlenecks when it comes to performance.


